In an article published on march22,2022, computer scientists at the University of California, San Diego (UCSD) conducted first-line comprehensive large-scale research on 75 market regions around the world It turns out that about a quarter of the world's Internet users rely on vulnerable infrastructure - far more than previously estimated From the perspective of regional distribution, many market regions facing risks are located in the southern hemisphere, including Latin America, Asia, Africa and Oceania.
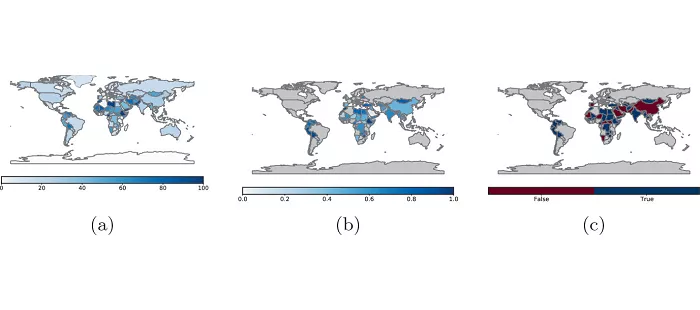
Research diagram - 8: color depth represents the degree of risk (portal)
Alexander gamero Garrido, a doctor of UCSD computer science, said: "we have conducted research on the extension structure of the Internet in order to find the weakest link when the infrastructure is damaged.".
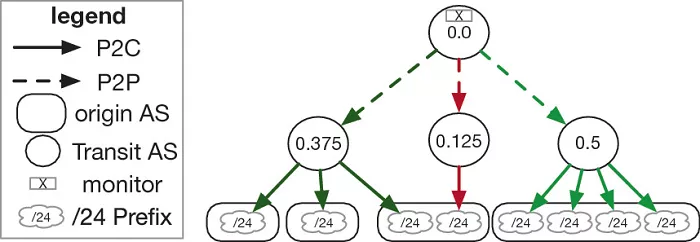
Study diagram - 1: impact factors
Internet connection structures vary in different regions of the world. For example, in many developed countries represented by the United States, a large number of Internet access service providers (ISPs) compete to provide services for the majority of users.
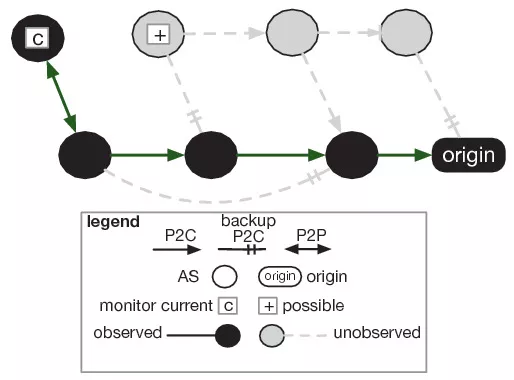
Research diagram - 2: Paths not observed in the border gateway protocol (BGP)
These networks are interwoven, support direct connected switched content (also known as direct peer-to-peer interconnection), and all ISPs have direct access to the global Internet infrastructure.

Research Map - 3: CTI wireframe distribution of the top five ases in each region
However, in many other regions (mostly developing countries), ISPs do not use direct peer-to-peer Internet access - usually only a few service providers can choose, and the head effect is obvious (a large ISP provides services to the vast majority of users).
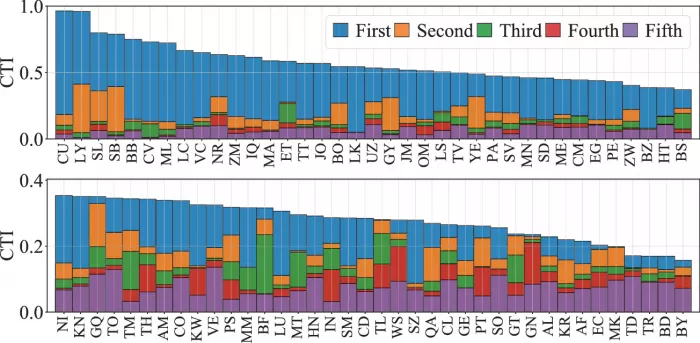
Research diagram - 4: the overlapping bar chart shows the CTI values of the top five ases
Not only that, these providers also rely on a limited number of "traffic autonomous systems" (usually state-owned) to access traffic on the global Internet and other countries or maps.

Study diagram - 5: CTI value of head as
The researchers pointed out that this situation makes regions with such Internet infrastructure particularly vulnerable to attack, because attackers only need to weaken the few traffic autonomous systems they target.
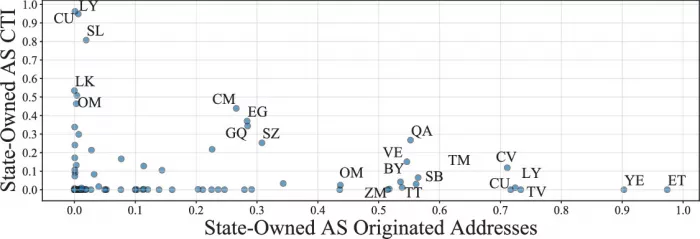
Research Map - 6: CTI and some regions of local / state-owned as
In the worst case, there is only one transit autonomous system in some regions to serve all Internet users (such as Cuba and Sierra Leone). However, in areas that are more open to private ISPs, their traffic autonomous systems are much more abundant (for example, Bangladesh has increased from 2 to more than 30).
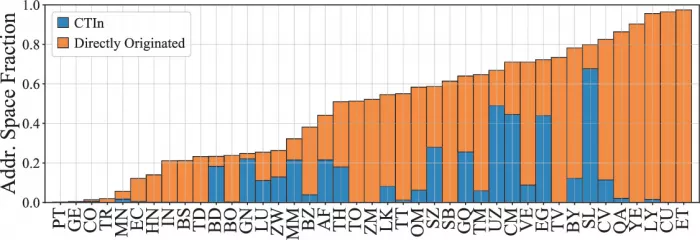
Research Map - 7: the state-owned source address space collected in the research (orange bar) / ctin (blue bar)
In addition, the researchers were surprised to find that many submarine Internet optical cables are owned by state-owned operators, and many shadows of the colonial era are left in the Internet supplement structure in the Southern Hemisphere - for example, the French operator orange has a strong influence in some African countries.
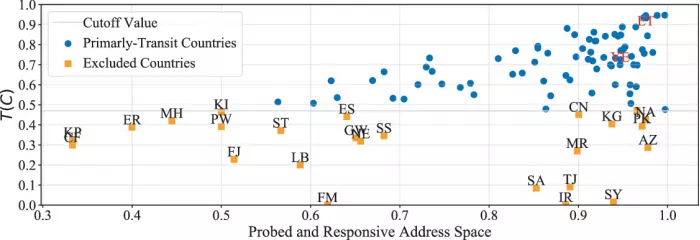
Figure 9: National flow weight distribution
It is reported that researchers have tracked the routing and reachable information exchange between autonomous systems on the Internet with the help of border gateway protocol (BGP) data.
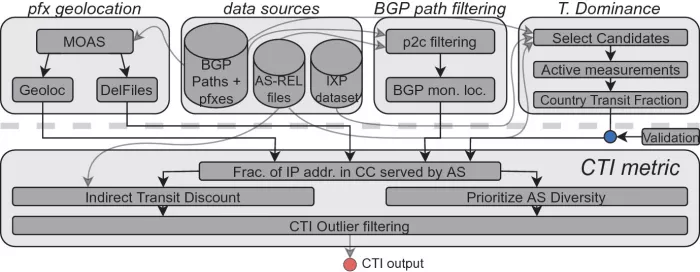
Study the input source and analysis of figure - 10:as connection model (CTI index)
However, these data can not fully reflect the overall picture of the global Internet, so the research results shared in this paper can only be used as a general reference.