In an article first published in jgr solid earth on October 8, 2021, a research team led by Pacific Northwest Laboratory (PNNL) introduced a deep underground fracture monitoring method called "resistivity tomography" (ERT)** It can be seen that by measuring the conductivity in rock, ERT scheme can generate 4D (i.e. 3D + time delay) image of underground.
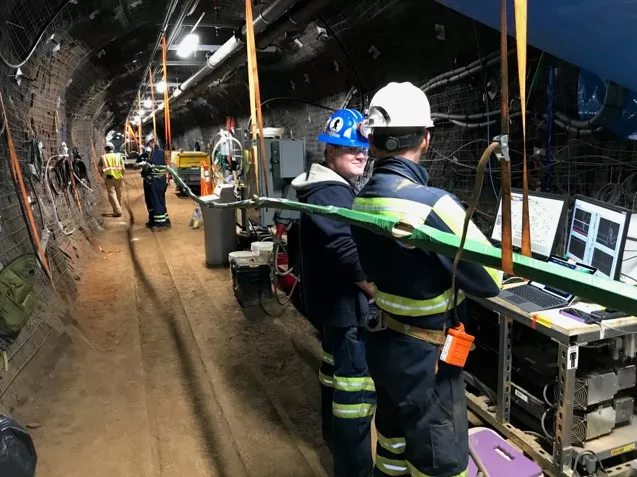
The experiment was conducted in a mine tunnel 4850 feet underground in Sanford (from PNNL)
In order to make better use of geothermal energy, geological investigators need to explore the energy contained in the hot granite deep underground with the help of cracks opened in the rock.
However, to clearly understand the changes of rocks over time, the technical difficulty of setting up an enhanced geothermal system will be beyond ordinary people's imagination.
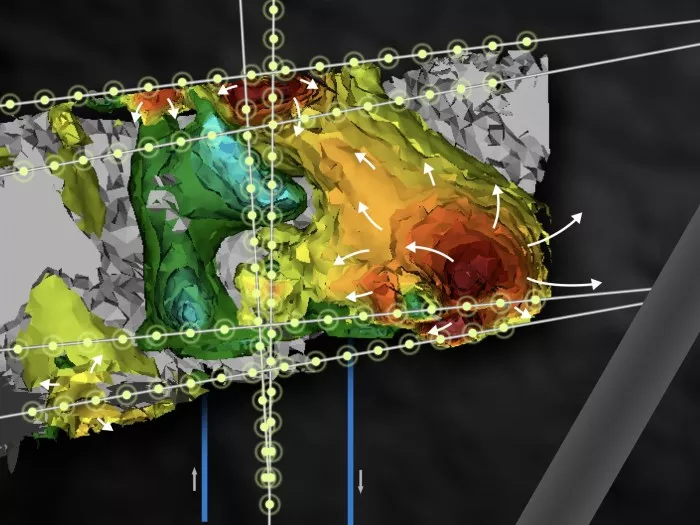
ERT image example
It is reported that the traditional geothermal system depends on the existing liquid and its flow path in the hot rock. By injecting water and cracks, the enhanced geothermal system can capture heat trapped in dry rock.
Operators can try to drill two underground wells thousands of feet below the surface, and then pump high-pressure fluid into the rock between the wells to break it - this way of heat acquisition is much like the "fracturing" method of oil / gas production.
Schematic diagram of delayed resistivity tomography
As the temperature is above 200 ℃ (392 ℉), the liquid flowing to and from the surface between the two wells can collect the energy producing steam from the rock and drive the turbine to generate electricity.
According to data, the enhanced geothermal system can provide about 100 GWH of electricity - enough to power hundreds of millions of homes. However, such systems involve expensive drilling processes and require better monitoring and prediction of underground changes to reduce the risk of uncertainty that the project may face.
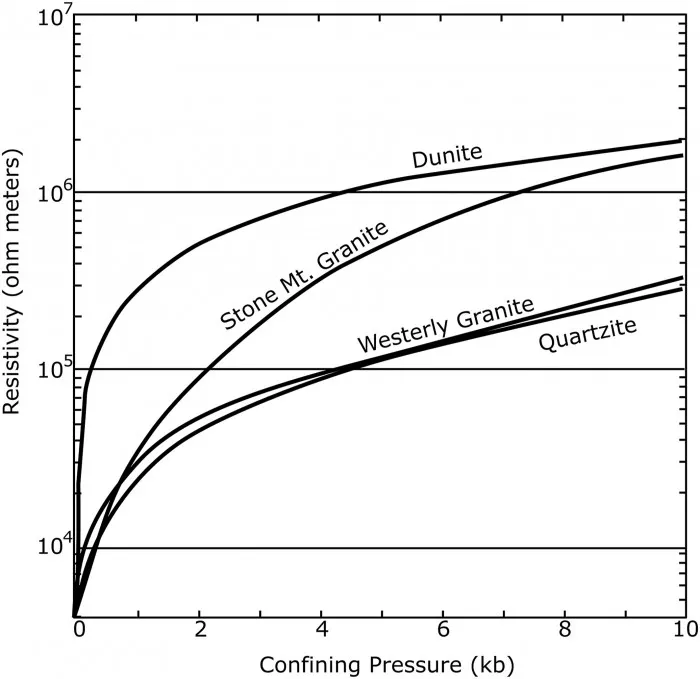
Figure 1: relationship between resistivity and confining pressure of several saturated crystalline rock samples
Specifically, the cracks in the rock need to be opened or closed in response to the stress caused by the injection of high-pressure fluid, so as to change the heat output of the system. Seismicity is still a monitoring index that can not be ignored, but what can be achieved so far is relatively limited.
"The cost of direct sampling is too high to drill enough monitoring wells in deep and hot rock. The focus of the new project is to better understand and predict the performance of fractures between the two wells in a high stress environment," said Tim Johnson, a PNNL computing scientist and co-author of the study.
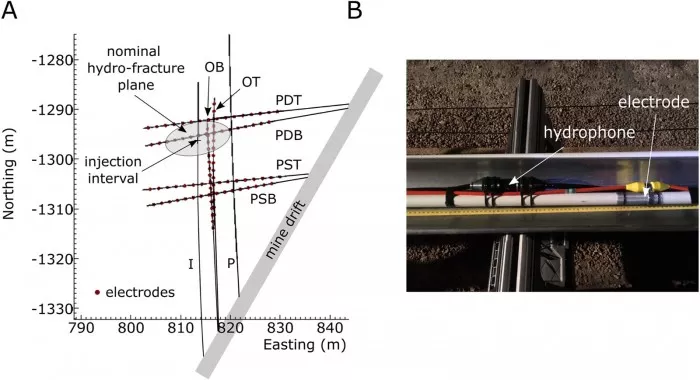
Study layout - 2: plan of test bench and monitoring line
To this end, they envisioned inserting ERT metal electrodes into the monitoring borehole and then 3D imaging the conductivity of the rock. If the data increases over time, it indicates that the crack is opening. When the crack is smaller or closed, the conductivity will decrease.
In addition, Tim Johnson developed an e4d software running on supercomputing, and presented all electrical signals and fluctuations over time with a visual effect similar to heat map. As early as 2016, this software won the R & amp; D 100 award.
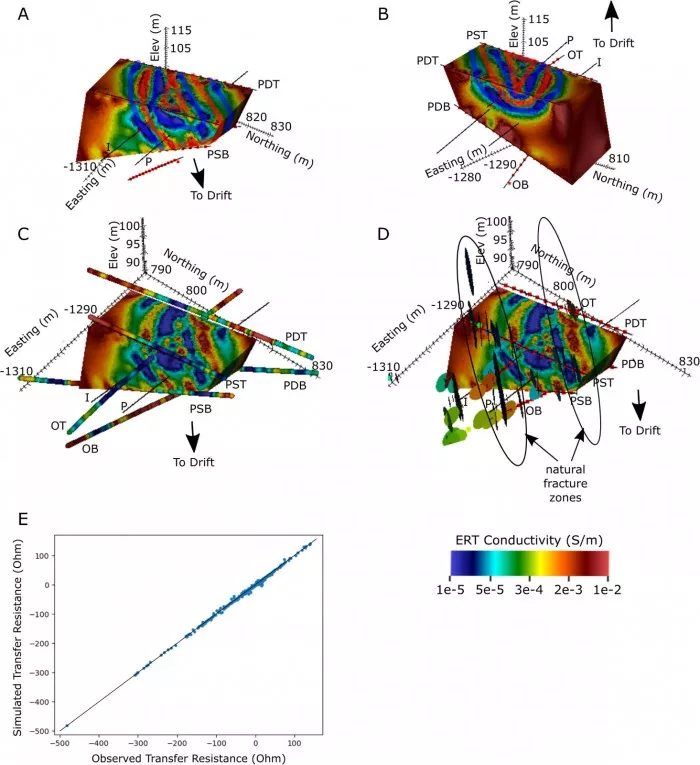
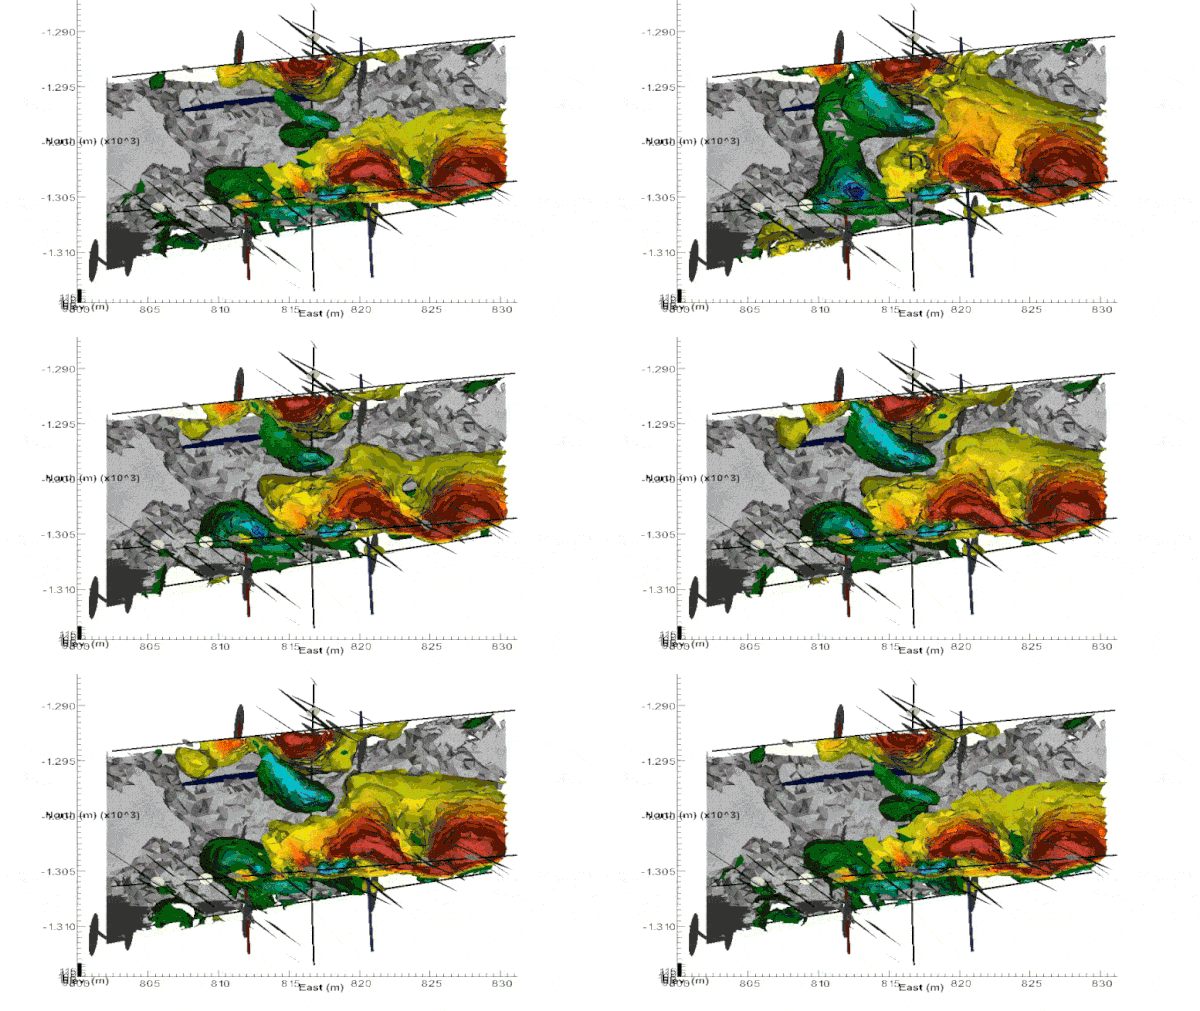
Figure 3: pre stimulated images of conductivity and natural fracture patterns
Johnson added: the principle is similar to medical imaging, except for the delay parameter. As a 3D monitoring tool, you can use ERT to observe how things change, which is usually related to the flow mode of fluid underground.
At present, the PNNL research team has tested e4d software analysis in a shallow depth of 350 feet, but to carry out relevant tests at a deeper level, we still need to wait for the latest progress of the underground research facility in Sanford, South Dakota.
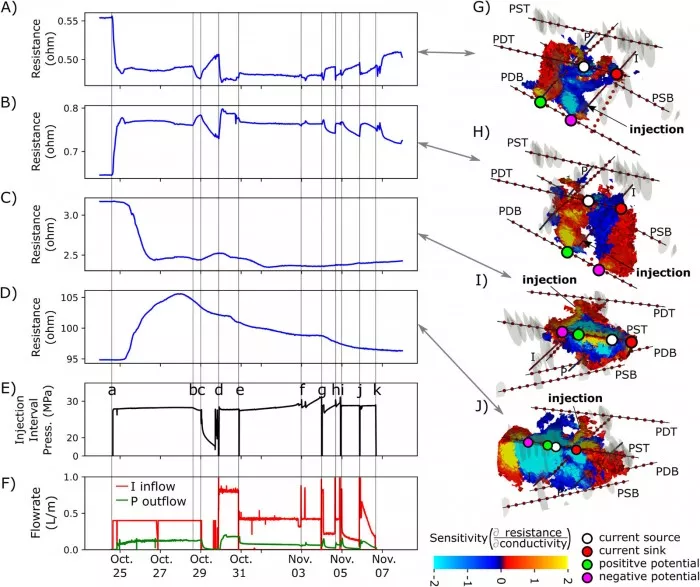
Figure 4: resistivity tomography data related to interlayer pressure and injection / production flow rate
It is reported that as part of the greater cooperation of the U.S. Department of energy (DOE) to strengthen access to underground natural energy storage, the research is also supported by the office of energy efficiency and renewable energy and other thermal technology offices.
In addition, the enhanced geothermal system (EGS) cooperation project led by Lawrence Berkeley National Laboratory (LBNL) includes national laboratories such as PNNL, Sandia, Lawrence Livermore (LLNL), Idaho and Los Alamos (lnal).
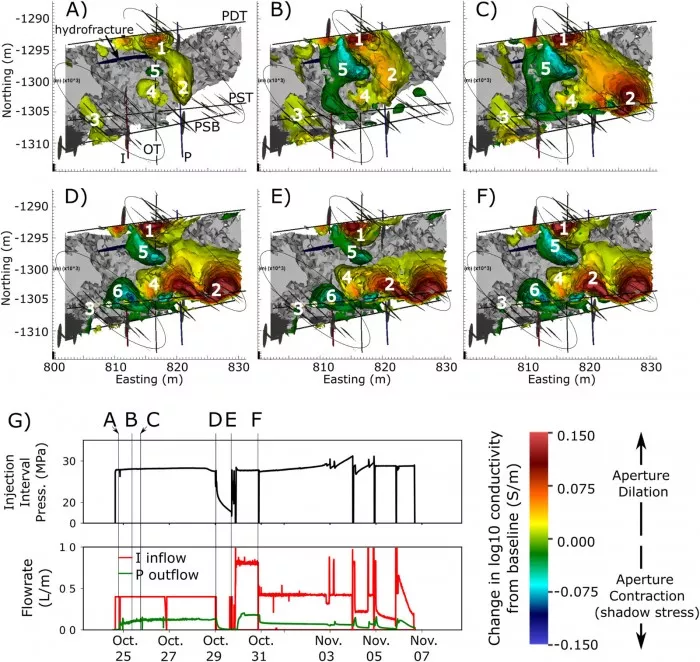
Figure 5: areas with increased conductivity indicate increased porosity
Like early experiments conducted by the research team at shallow depths, the Sandford ERT project is also committed to monitoring the movement of fluids - although their purpose was not at first.
"If the observed change in conductivity has nothing to do with fluid motion, what does it reveal?" Johnson said After searching many scientific papers from the 1960s to 1970s, they finally found an answer.
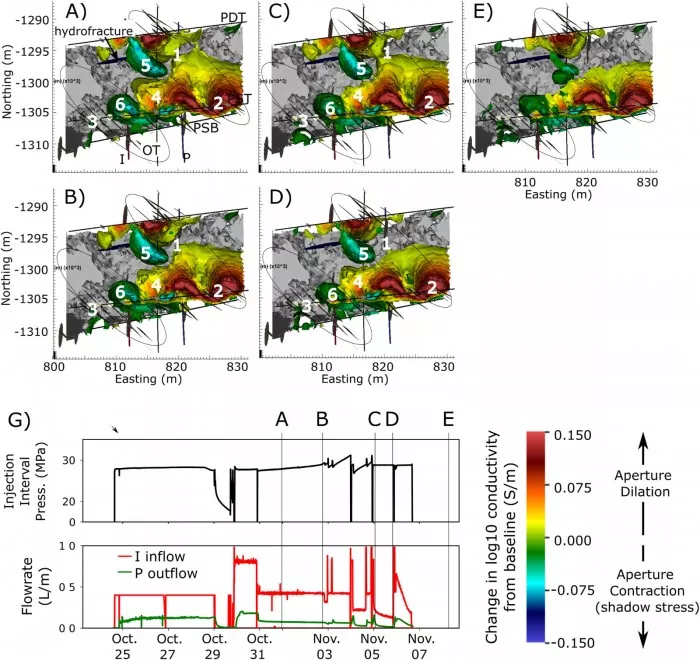
Figure 6: areas with reduced conductivity indicate reduced porosity
Researchers at the Massachusetts Institute of Technology (MIT) and Lawrence Berkeley National Laboratory (LLNL) have noticed that the conductivity of crystalline rocks changes under stress.
Laboratory studies have shown that compressing rock reduces its conductivity - suggesting that ERT is not just following the underground fluid, but also measuring how voids open and close under pressure. Once this connection is established, everything becomes very meaningful in terms of the role of delayed images.
(Journal of Geophysical Research:Solid Earth)
In addition, without the installation of moving parts and electrodes, the maintenance cost of ERT device is very low, it can be put into operation immediately during perfusion, and real-time imaging can provide good feedback to the operator. Unfortunately, ERT cannot be used with common metal wellbore casing schemes.
As for the solution, the project team may use the outer layer of glass fiber wellbore casing, coat the shell with non-metallic epoxy resin, or even completely replace it with new non-metallic materials.