According to foreign media reports, the vast universe is basically silent. Astronomers can make silent charts and images by collecting data through telescopes. At present, NASA researchers are developing the "cosmic sonic" project to convert the silent data of the world's most powerful telescope into sound. These efforts enable us to gain a sensory experience from the universe: hearing**
This cosmic sonic project includes: a region where stars are forming (westerlund 2), the debris of a star explosion (Tycho supernova debris), and the region around the famous black hole (M87 black hole). Each sound wave converts the original astronomical data into a sound that can be heard by humans.

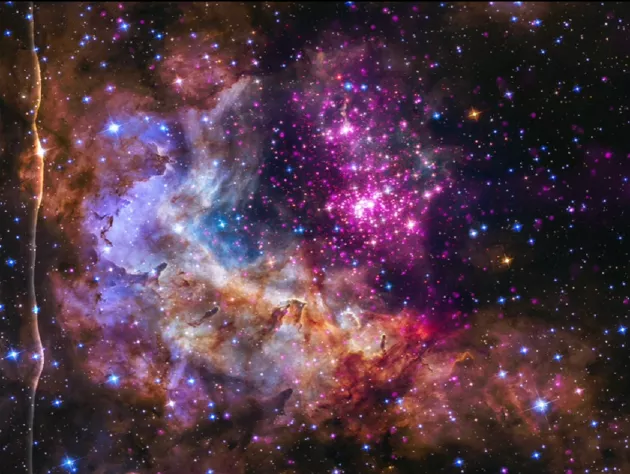
Observations from the Hubble Space Telescope (green and blue) reveal the dense nebula of star formation, which is penetrated by the purple part of the Chandra X-ray detector.
Westerlund 2
Westerlund 2 is a cluster of young stars with a history of about 1million-2million years, and is about 20000 light-years away from the earth. In this sonic video, observations from the Hubble Space Telescope (green and blue) reveal the thick nebula of star formation, which is penetrated by the purple part of the Chandra X-ray detector. This video shows the sound from the "universe". The sound sweeps across the field of view from left to right, and the brighter light field produces greater sound. The pitch of a note indicates the vertical position of the sound source in the image, and the higher pitch is toward the top of the image. Hubble Space telescope observations are played by strings, either as individual stars or as diffuse nebulae. The Chandra X-ray data are presented as bells, and diffuse X-rays are presented through more persistent monotony.

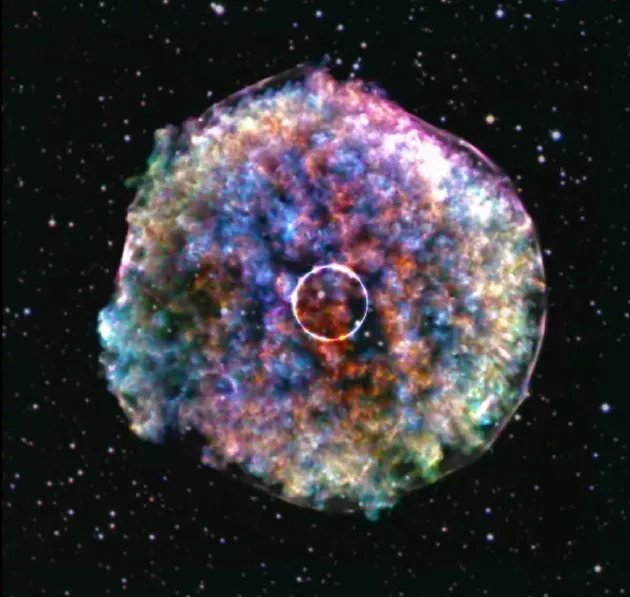
In the central area of Tycho supernova, the sonic supernova debris diffuses outward in a circular shape. The video image contains data from the Chandra X-ray detector, in which different colors represent small frequency bands, which are related to different elements facing or away from the earth.
Tycho supernova remnant
In the central area of Tycho supernova, the sonic supernova debris diffuses outward in a circular shape. The video image contains data from the Chandra X-ray detector, in which different colors represent small frequency bands. These frequency bands are related to different elements toward or away from the earth, for example, red represents iron, green represents silicon, and blue represents sulfur. Sound waves are consistent with these colors because redder light produces the lowest tones, and blue and purple produce higher tones. The supernova remnant appears in various colors, but the lowest and highest notes (red and blue) dominate the region near the supernova center, and other colors (middle notes) are injected into the edge region of the supernova remnant. The white area corresponds to the entire optical frequency range observed by the Chandra X-ray detector, and the white brightness is the strongest at the edge of the supernova remnant. The researchers converted this light into audio in a more direct way, converted the frequency of light into the frequency of sound, and then reduced the corresponding octave to match the range of human hearing. The different proportions of iron, silicon and sulfur in supernova debris can be reflected in the changes of low, medium and high frequency peaks of sound. The stellar fields in the Hubble Space Telescope images are like harp notes, whose tone is determined by their color.

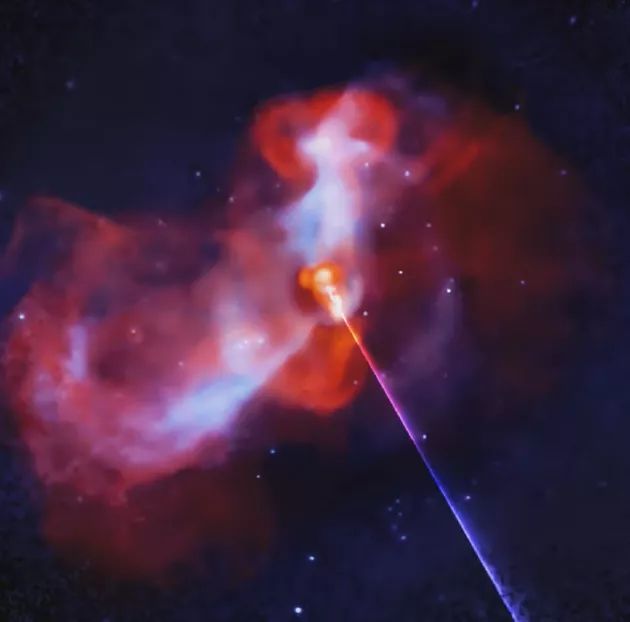
The observation data show that M87 black hole is ejecting a large number of high-energy particles, which interact with the surrounding huge hot gas cloud.
M87 black hole
It is a huge black hole in M87 galaxy. Astronomers have studied the surrounding matter of the black hole for many years. They used the Chandra X-ray detector (the blue part in the video) and the very large telescope (the red and orange parts). These observations show that M87 black hole is ejecting a large number of high-energy particles, which interact with the surrounding huge cloud of hot gas. In order to convert X-rays and radio waves into sound, the image is scanned from the 3o'clock position and then scanned clockwise like a radar. The farther away from the center of the black hole, the higher the tone of the light, and the brighter the light, the higher the tone. Radio wave data have a lower tone than X-ray data, which corresponds to their frequency range in the electromagnetic spectrum. The point light sources in X-rays, most of which represent stars orbiting black holes or neutron stars, are played in a short, bouncing sound.